
The ability to analyze the profitability of your business is one of the most powerful tools a retailer can possess. There are many ways to gauge profitability, but an honest assessment involves particular metrics that can be applied to every cash product you sell.
Metric #1: Gross Margin
It is important to set the right gross margin to ensure you are both profitable and competitive. Retailers can use a product’s MSRP as a guide and discount that amount as necessary to target the optimal selling price that will provide the necessary gross margin. It’s a simple mathematical formula depending on whether you want to calculate gross margin dollars or gross margin percentage. Below are both formulas:
- Gross margin dollars = retail selling price – wholesale cost
- Gross margin percentage = retail selling price – wholesale cost/retail selling price
Ideally, your gross margin percentage should fall between 40 and 45 percent. Important focus points include the following:
- Is someone dedicated to selling this particular product category?
- Do they understand the features, advantages and benefits (FABs) for each product?
- Are the product samples showing all of the best features available?
- Do you know the true cost associated with each of the products that you are selling?
Metric #2: Gross Margin Return on Investment (GMROI)
An important tool when analyzing inventory is GMROI, which determines whether a sufficient gross margin is being earned by products compared to the inventory investment required to generate the gross margin dollars. Quite simply, which products in your store yield the most bang for the buck? The simple formula below looks at gross margin as it relates to inventory annually.
- Total annual gross margin dollars/average annual inventory investment
Keep in mind that without a strong gross margin, this metric will not apply. If you have set up your gross margin appropriately, it is possible to be earning up to $10 in profit for every $1 you spend on inventory. Important questions regarding GMROI include:
- Do you have the right product selection on your floor?
- Is the product placed and presented the right way?
- Are your floor models backed with stock?
Metric #3: Dollars Per Square Foot
Retail space is limited and expensive. Are you squeezing every dollar from each square foot of space without making your store look crowded, cluttered and disorganized? The equation to determine your dollars per square foot looks like this:
- Dollars per square feet = retail sales/total square feet
Metric #4: Inventory Turn Rates
Knowing how fast your inventory turns will help you manage stock to maximize profit. Lower-margin items will need to turn faster than higher-margin items to generate the same profit. You must know which products are worth the wait and which are not. This formula helps with those decisions.
- Inventory turn rate in units = total units sold/total units in inventory
Stock what sells best. Always set a goal to make the products with the highest gross margin (Metric #1) turn the fastest. Many manufacturers like to consign products, which take up space on your showroom floor. They aren’t really free if they aren’t directly generating sales. Even consigned products need to turn to generate profit. If they aren’t, then they are negatively impacting your profit per square foot and costing you money.
Metric #5: Average Ticket Sales
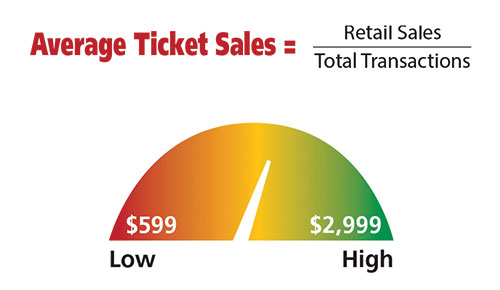
Sales growth usually comes from high traffic counts, but growth can also come from higher average ticket sales. If your first four metrics are strong to this point, this metric is a great place to focus. Are you looking to grow? Why not sell higher-priced products as well? Here, we must focus on selling price, not cost. The formula to calculate average ticket sales is pretty straightforward:
- Average ticket sales = retail sales/total transactions
Your customer service staff should focus on promoting higher-value products, accessories, custom options, added services and complementary products as ways to increase the average ticket.
Metric #6: Traffic Flow
All retail business owners are aware that increased traffic equals increased sales, while zero traffic will amount to zero sales. What is your traffic rate? What are you doing to increase traffic? In the last several articles I have discussed building traffic to drive sales. There are several focus points to help drive traffic to your storefront.
- Develop a marketing plan of action, and follow it. Set a schedule for advertising and promotions, and make sure everyone in your store is aware of this program. Ensure that you are properly promoting this through a variety of advertising sources.
- Signage is important, both outside of your store to draw traffic and inside your store to promote sales and specialty products.
- Social media is becoming more and more important in the world of public relations and promotions. Facebook is a very popular social media outlet for people ages 65 and older. Targeted, specific messages about your business on Facebook can generate steady traffic.
Metric #7: Close Rate
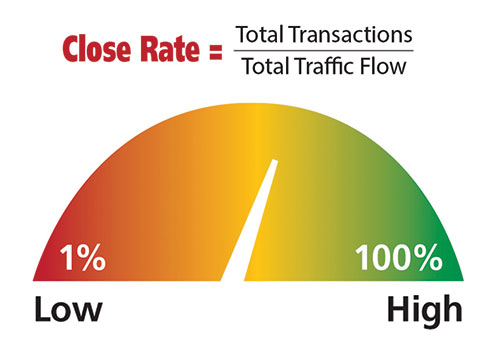
People are not in your store to browse and see what fits. People go to a DME store to fill a particular need. Your close rate at a DME business should be nearly 100 percent. Customers shouldn’t walk out the door without the product that will solve their needs either in their hands or on order. To calculate your close rate, follow this formula:
- Close rate = total transactions/total traffic flow
For example, if 20 people walk into your showroom today and only 10 buy, your close rate is 50 percent. For a DME provider, close rates should be closer to 90 percent, if not higher. Some focus points to improve your close rate are:
- Make sure you qualify the customer, knowing what type of condition they have to determine the right product for them. If Medicare or insurance is involved, make sure they have the proper documentation necessary.
- Are you asking the right types of questions to close the sale? Are you asking open-ended questions that will create a dialogue between you and your customers to help find the best solution for them?
- Do you have the products available on your floor for customers to try?
- Does your staff have the knowledge to satisfy the needs of your customers?
Metric #8: Cost Per Customer Walk-in
We all know that marketing can be expensive, but it’s important to look at it as an investment in your business. You have to invest dollars to bring traffic to your showrooms. If you know the cost of your marketing, you will feel more compelled to find ways to help customers purchase. To calculate this metric, use this formula:
- Cost per walk-in = total marketing and advertising expenses/total traffic
Metric #9: Cost Per Transaction
The final metric is the cost per transaction. You’ve measured the cost of drawing customers through the door, now what does it cost to turn them into a sale? Cost per transaction measures the effectiveness of your marketing and advertising program at driving not just shoppers, but also buyers. To calculate this metric, use the following formula:
- Cost per transaction = total marketing and advertising expenditure/total transactions
This is another one of those formulas where you want the results to be low. Combining the results of each of these metric calculations will help you to know where you are, decide where you want to go and set a path to get there. The numbers themselves mean nothing, however. It’s what you do with the information that is the key to your success.